
Machine Learning


Who survived the Titanic, and what did survival actually depend on? For my first start-to-finish exploratory data analysis, I took the classic Titanic passenger dataset and worked it from raw load to published findings in a single sprint: cleaning missing data, engineering features, and pulling out the patterns behind who made it off the ship.
The dataset covers 891 passengers with their age, sex, ticket class, fare, family aboard, and boarding port. I chose it deliberately for its massive community support, so I could focus on sharpening my pandas, seaborn, and matplotlib workflow instead of fighting the data.
Full notebook and code: WayneS0628/titanic-eda
Every column with missing values got its own treatment, chosen based on how much was missing and what the column represents:
embarked and alive duplicated embark_town and survived, so they were dropped.I also engineered one feature: sibsp (siblings/spouses aboard) and parch (parents/children aboard) both measure family, so I combined them into a single family_size column.
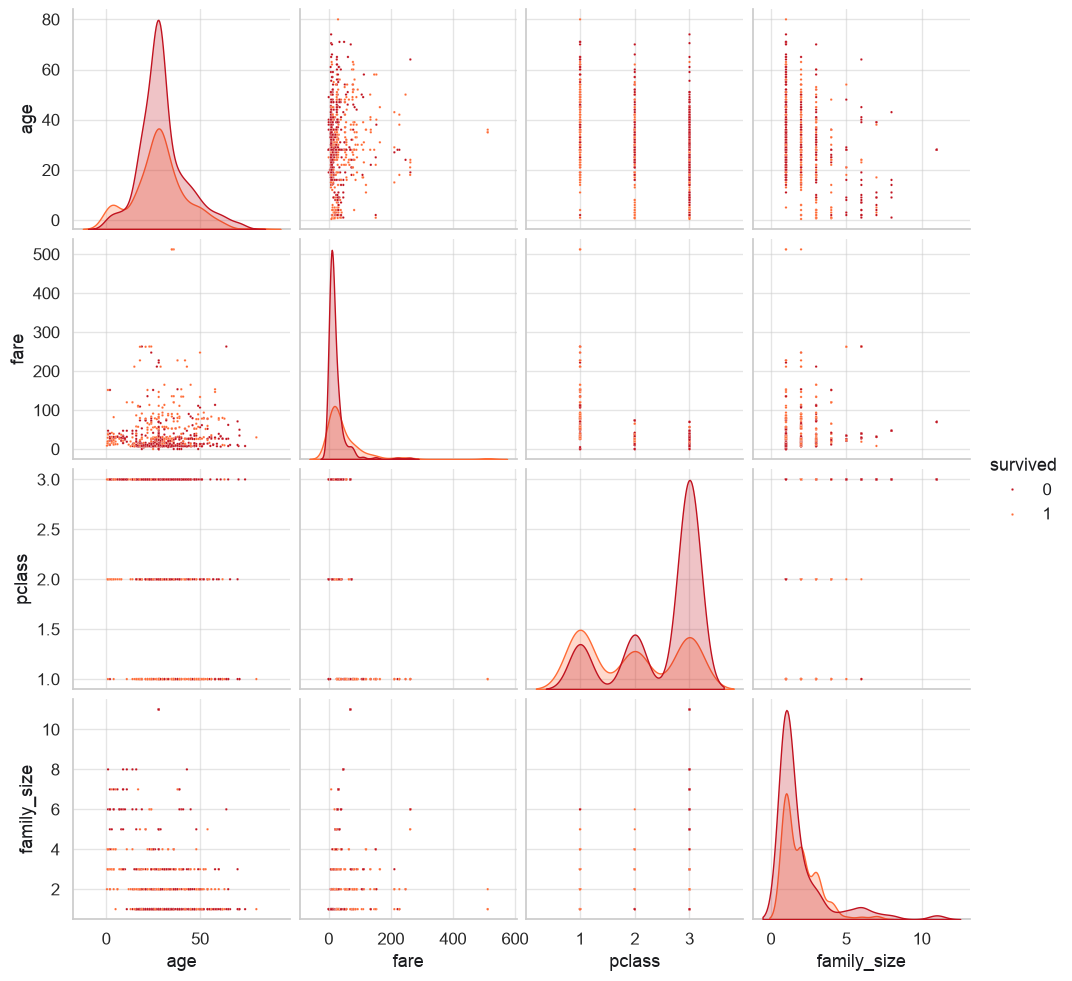
Before targeted questions, a pairplot across the numeric features as a quick scan for relationships worth digging into. It flagged class as a strong separator of survivors, which shaped the sections that follow. Fun for a first look, but the focused charts below do the real work.
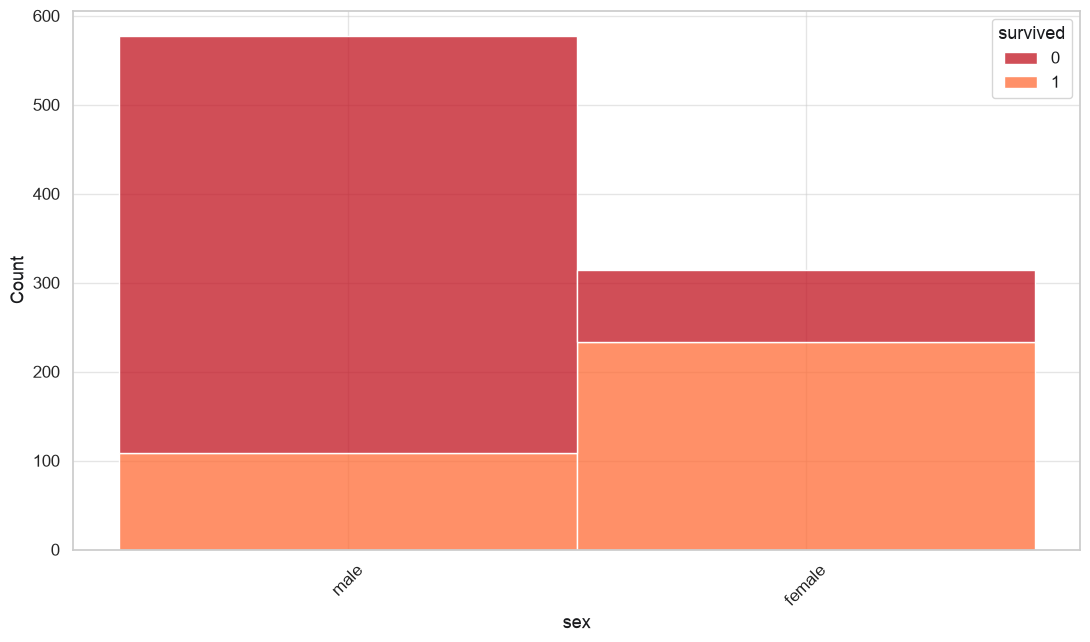
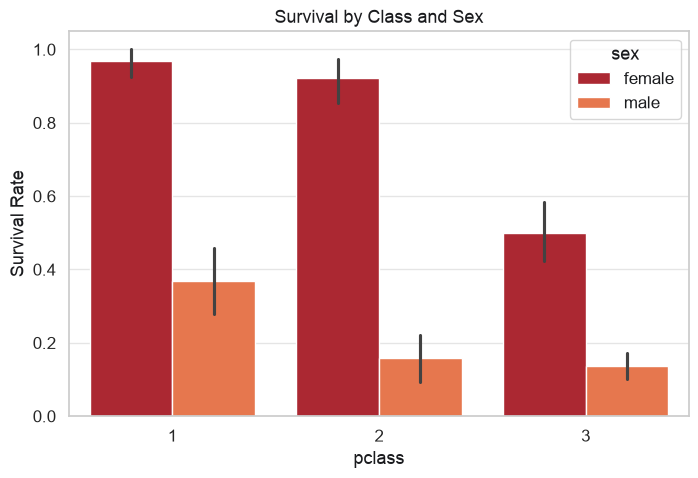
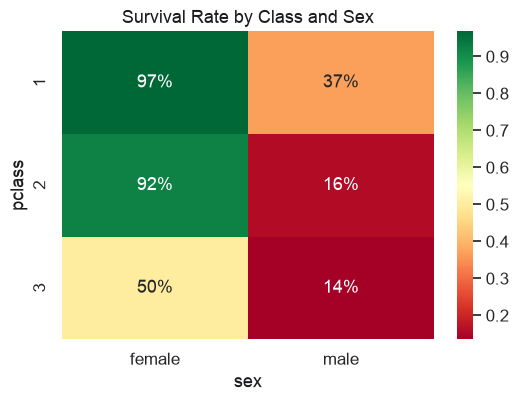
The two strongest survival factors, viewed from three angles: raw counts, rates side by side, and a rate scoreboard. Women in first class survived at roughly 95% while men in third class survived at roughly 15%. Nothing else in the dataset comes close to that gap. The stacked counts also show that women out-survived men despite being outnumbered on board.
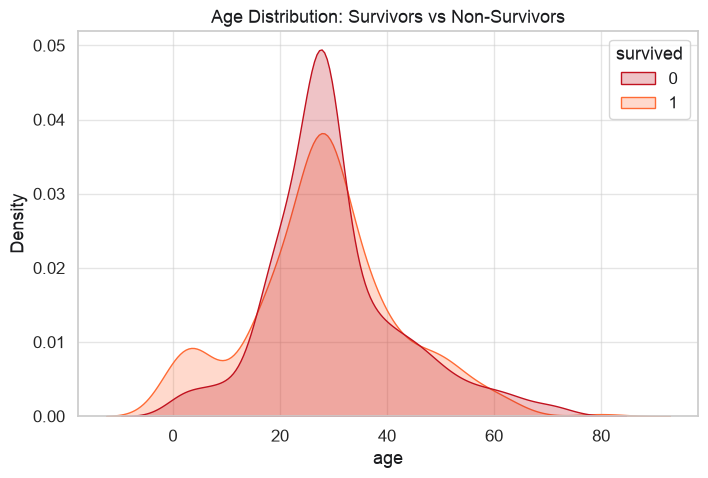
Overlaid density curves of survivor and non-survivor ages tell the “women and children first” story numerically: a clear survival bump for children under 10, while adults between 20 and 35 fared worst. One honest caveat: about 20% of ages were median-imputed, which adds an artificial spike at the median age.
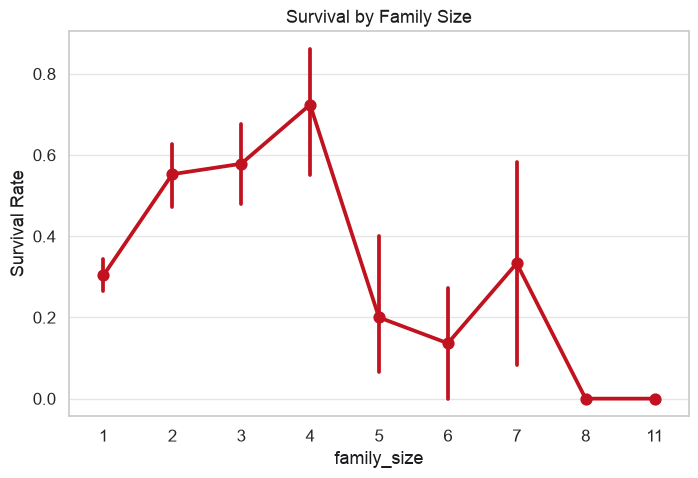
Plotting survival rate against family size shows a rise-then-fall pattern: families of 2 to 4 survived at the highest rates, beating both solo travelers and large families. The error bars widen at larger family sizes because few passengers traveled in big groups, so those estimates are less reliable.
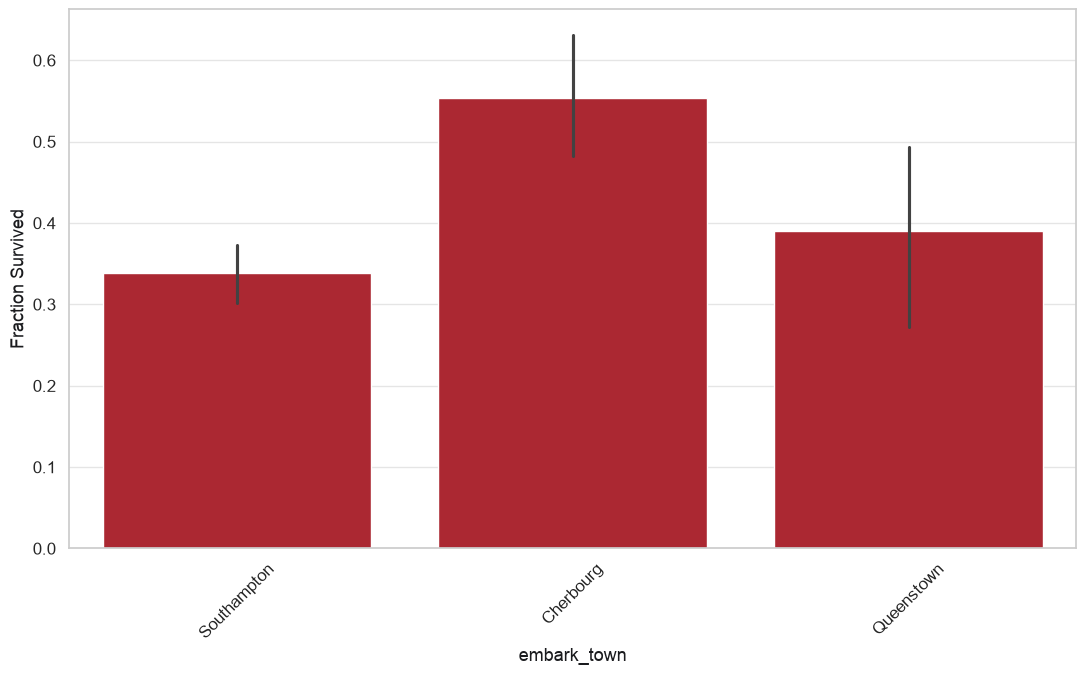
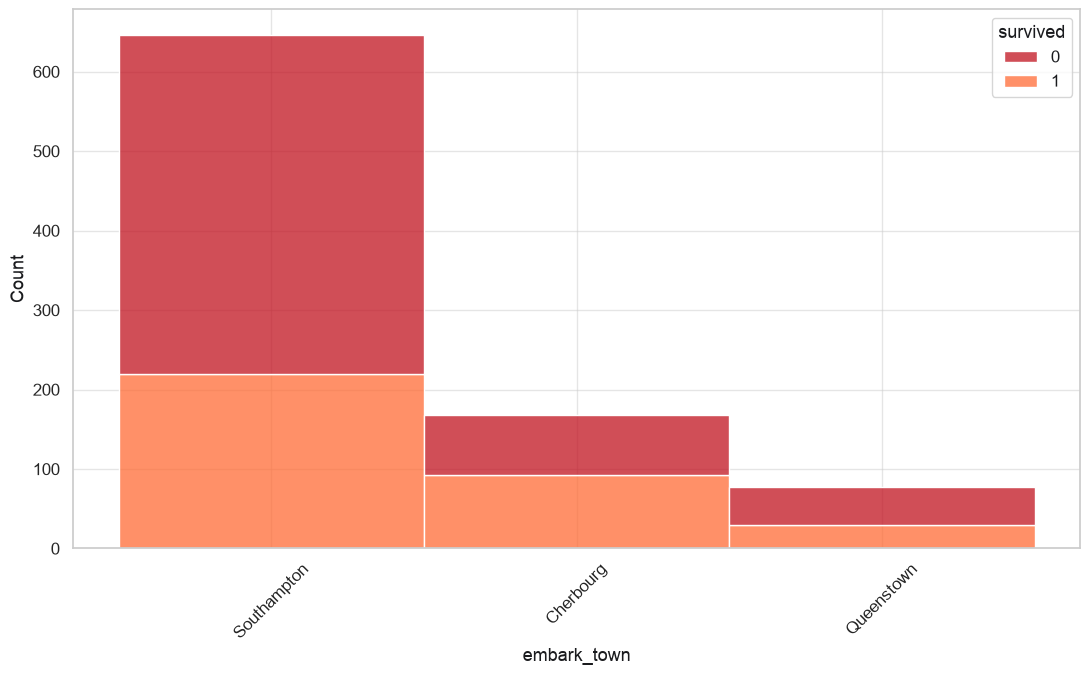
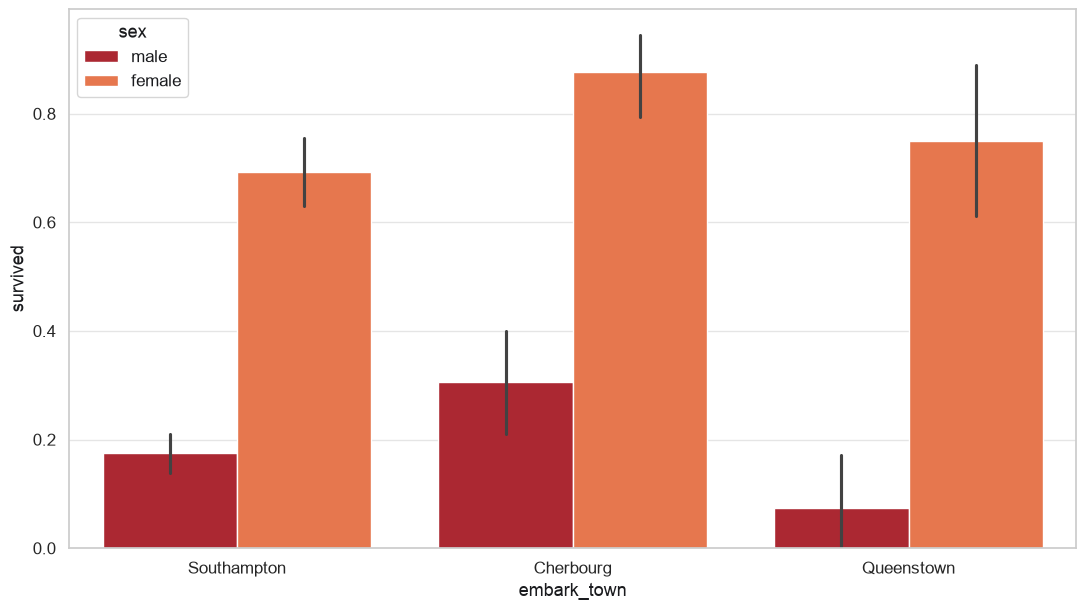
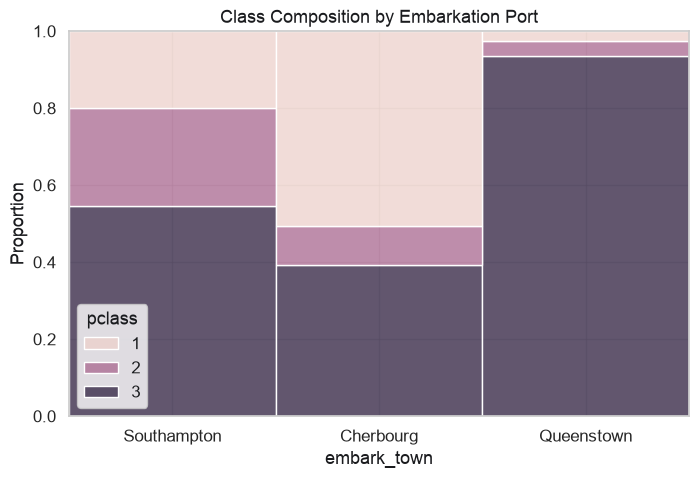
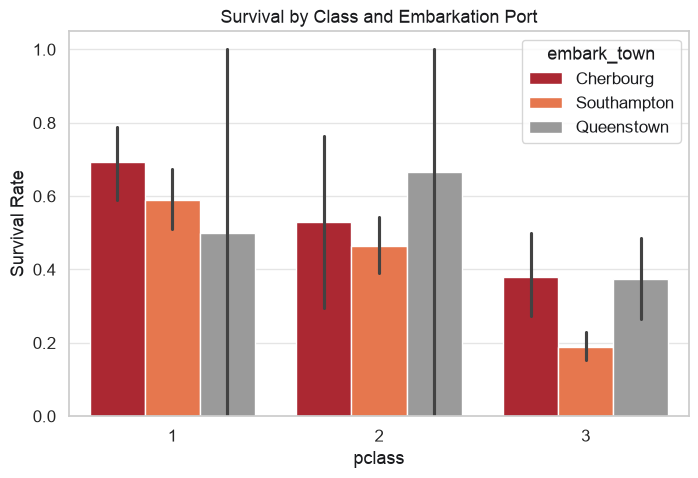
My favorite thread of the project. Passengers who boarded at Cherbourg, France survived at noticeably higher rates than those from Southampton or Queenstown. Rather than reporting that at face value, I suspected a confounder and checked the class composition of each port: roughly half of Cherbourg’s passengers were first class, while the other ports were dominated by third.
After controlling for class, most of Cherbourg’s advantage disappeared, though a residual gap remained, most visibly in third class. One more honest caveat: Queenstown’s upper-class estimates have huge error bars because almost nobody from Queenstown traveled first or second class.
Beyond the findings themselves, this project was about building confidence in my tools: per-column missing data strategies, feature engineering, reading confidence intervals critically, and knowing when a chart shows rates versus raw counts. I also documented what I’d do differently rather than hiding it, which turned out to be some of the most valuable writing in the notebook.
Explore the full analysis, cleaning decisions, and limitations on GitHub: WayneS0628/titanic-eda